Debugger
 The debugger window
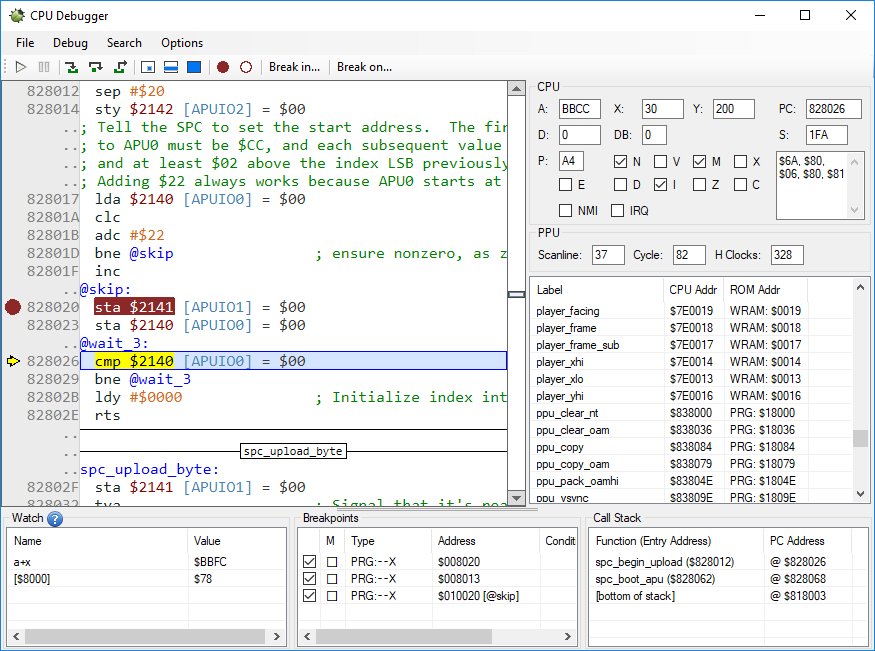
This window displays the disassembled code and allows you to configure breakpoints, labels and watch values. It also contains a large number of options and smaller features – all of which are described below.
Each supported CPU has its own debugger window and its own set of breakpoints and watch values.
General Usage Tips
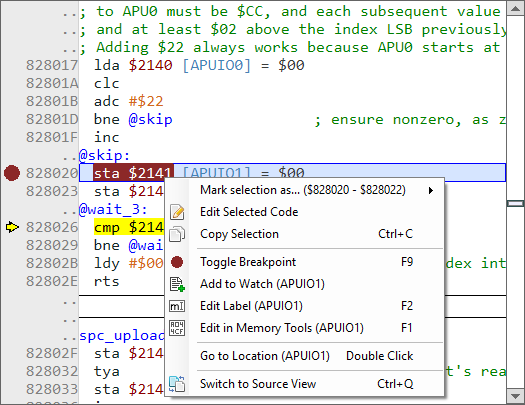
Most elements in the debugger’s interface have right-click menu options - make sure you explore the right-click options available in each list and window.
Watch expressions, breakpoints and labels are automatically saved on a per-rom basis. These are stored in a .xml file in the Debugger folder.
Search Tools
There are a number of different tools that can be used to search/navigate the code:
 Go To All
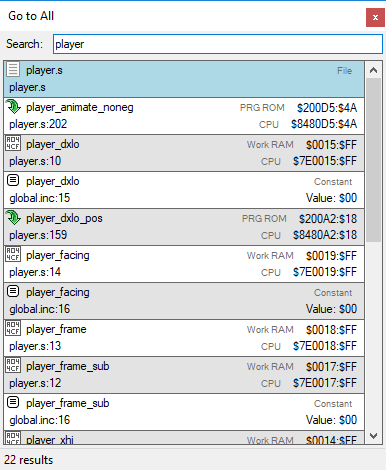
- Go To All: The Go To All feature allows you to search for any label by its name and navigate to it. It also works with CA/CC65 and displays the location of the labels in the original source code. (Ctrl+,)
- Find/Find Next/Find Previous: Incremental search that can be used to search through any text shown in the code window (Ctrl+F)
- Go To…: These options allow you to quickly reach the NMI, IRQ or Reset handlers or a specific address (Ctrl+G)
Customizing the debugger
All keyboard shortcuts can be customized in Options→Customize Shortcut Keys
The font used in the code window can be customized in Options→Font Options→Select Font
The colors used for syntax highlighting can be changed in Options→Configure Colors
Code Window
 Code Window
The code window displays the disassembled code and contains a number of features and options.
General information
- Several options control what is shown in the code window, and how it is shown - see Display Options below.
- Labels and comments defined in the label list are shown in the code.
- Single-line comments appear on the right, multi-line comments appear on top.
- The instruction that’s currently executing is highlighted in yellow.
- Mouse-hovering any label or address will display a tooltip giving additional information (label, comment, current value in memory, etc.)
Disassembly Options
Unidentified Code/Data: Configures how to display bytes when the debugger has not yet determined whether these bytes represent code or data.
Verified Data: Configures how to display bytes that the debugger has marked as data.
Show in lower case: When enabled, OP codes and hexadecimal values are displayed using lowercase letters
Show byte code: When enabled, the byte code matching the instructions will be displayed next to them (on the left)
Use alternative mnemonics (SPC only): When enabled, the disassembly will use an alternative set of mnemonics for the instructions.
CPU/PPU Status
 Emulation Status
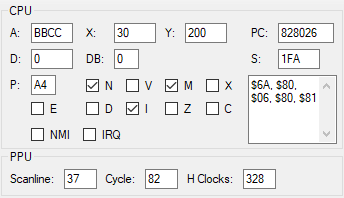
This section of the debugger window displays the CPU and PPU’s current state. The values displayed vary depending on the CPU type.
Note: These values are (currently) read-only.
Watch List
 Watch List
The watch list allows you to evaluate expressions and see their value.
To add a new watch expression, click on the last empty line in the list to enter edit mode.
To edit a watch expression, double-click on it to enter edit mode.
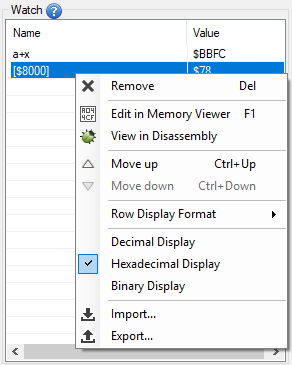
You can use the right-click context menu to delete or move entries, as well as select formatting options.
An import and export feature is also available to save/load watch expressions from a plain text file.
Syntax
The syntax is identical to C/C++ (e.g && for AND, || for OR) and uses the same operator precedence as well.
Use the $ prefix to denote hexadecimal values (e.g: $FF) or the % prefix for binary values (e.g: %1101)
Operators
The following operators are supported (same usage/precedence as C):
*, /, %, +, -, <<, >>, <, <=, >, >=, ==, !=, &, ^, |, &&, ||, ~, !, (, )
Additionally, the following special operators exist:
- [address/label]: Surrounding a value/expression with brackets will read the corresponding memory address and return its value (1 byte).
- e.g:
[$8000]will read the value at address $8000 and return it.
- e.g:
- {address/label}: Surrounding a value/expression with curly brackets will read the corresponding memory address and return its value (2 byte).
- e.g:
{myLabel}will read 2 bytes of memory at the address represented by themyLabellabel and return its value
- e.g:
Special values
The following “variables” can be used in both the watch list and contional breakpoints to check the state of specific portions of the emulation core.
Each CPU type supports its own set of special values.
Common values
- Cycle/Scanline: Current cycle (0-340)/scanline(-1 to 260) of the PPU
- Frame: PPU frame number (since power on/reset)
- Value: Current value being read/written from/to memory
- Address: Current CPU memory address being read/written
- IsRead: true if the CPU is reading from a memory address
- IsWrite: true if the CPU is writing to a memory address
CPU and SPC
- A/X/Y/PS/SP: Value of corresponding registers
- PC: Program Counter
- OpPC: Address of the current instruction’s first byte
- IRQ: true if the IRQ flag is set
- NMI: true if the NMI flag is set
Game Boy
- A/B/C/D/E/F/H/L: Value of corresponding registers
- PC: Program Counter
- SP: Stack Pointer
GSU (Super FX)
- R0 to R15: Value of corresponding registers
- SrcReg: Source Register
- DstReg: Destination Register
- SFR: Status Flags Register
- PBR: Program Bank Register
- RomBR: ROM Bank Register
- RamBR: RAM Bank Register
Formatting
It is possible to customize the format of each entry by adding a suffix to the expression. Suffixes contain a single letter and are optionally followed by a number indicating the number of bytes expected in the return value (up to 4).
The available suffixes are:
S- Signed decimal valueU- Unsigned decimal valueH- HexadecimalB- Binary
For example, suffixing an expression with:
, H2will display the result as a 2-byte hexadecimal value (e.g:26, H2will display as$001A), Bwill display the result as a binary value (e.g:141,Bwill display as%10001101), S2will display the result as a 16-bit signed decimal value (e.g:$FE4F, S2will display as-433), Uwill display the result as an unsigned decimal value (e.g:180, Uwill display as180)
You can select the default format to use for entries without prefixes by right-clicking and choosing between:
- Decimal Display (equivalent to
S4to all entries - displays the result as 32-bit signed decimal values) - Hexadecimal Display (equivalent to
H1to all entries) - Binary Display (equivalent to
B1to all entries)
Usage Examples
[$10] //Displays the value of memory at address $10 (CPU)
a == 10 || x == $23
scanline == 10 && (cycle >= 55 && cycle <= 100)
x == [$150] || y == [10]
[[$15] + y]   //Reads the value at address $15, adds Y to it and reads the value at the resulting address.
{$FFFC}  //Returns the reset handler's address.
[$14] | ([$15] << 8), H2  //Display the value of the 2-byte variable stored at $14 in hexadecimal format.
Using labels
Any label defined in the debugger can be used in watch expressions (their value will match the label’s address in CPU memory).
For example, if you have a label called “velocity” that points to 1-byte value at address $30 in the CPU’s memory, you can display its value in the watch using the following syntax: [velocity]
Displaying arrays
The watch list allows you display several consecutive memory values on the same row using a special syntax. e.g:
[$30, 16]      //This will display the values of addresses $30 to $3F
[MyLabel, 10]  //This syntax can also be used with labels
Breakpoints
 Breakpoint List
Breakpoints define conditions under which the execution of the game’s code will be suspended. Any number of breakpoints can be defined.
You can also make a breakpoint appear as a mark on the Event Viewer by checking the M column.
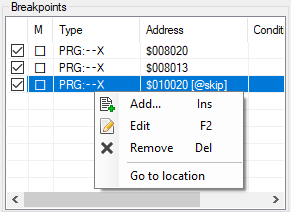
To add a breakpoint, right-click the breakpoint list and select Add.
To edit a breakpoint, double-click on it in the list.
To disable a breakpoint, uncheck it.
To delete a breakpoint, right-click on it and select Delete
To view the breakpoint in the code, right-click on it and select Go to location
Breakpoint configuration
 Edit Breakpoint Window
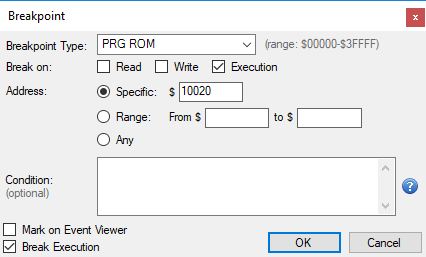
Breakpoints can be set to trigger based on CPU/PPU memory accesses at specific memory addresses.
Breakpoint Type
Select the type of memory for which you want to set a breakpoint. The valid range of addresses for the breakpoint will vary based on the selected memory type.
Break On
Select which types of accesses (read, write or execute) should trigger the breakpoint.
Address
Select which address or address range this breakpoint should apply to.
It is also possible to specify no address at all by selecting Any - in this case, breakpoints will be evaluated on every CPU cycle.
Condition (optional)
Conditions allow you to use the same expression syntax as the one used in the Watch List to cause a breakpoint to trigger under specific conditions.
Mark on Event Viewer
When enabled, a mark will be visible on the Event Viewer whenever this breakpoint’s conditions are met. This can be used to add marks to the event viewer based on a variety of conditions by using conditional breakpoints.
Break Execution
This enables the breakpoint - if this is disabled, the execution will not break when the breakpoint is hit.
Examples
To break when the sum of the X and Y registers is 5:
x + y == 5
To break when the value at memory address $10 is smaller or equal to $40:
[$10] <= $40
To break when the CPU writes the value $60 to any address:
IsWrite && Value == $60
Call Stack
 Call Stack example with labels
The call stack displays the currently executing function, and all functions that are below it on the stack. The top of the list is the current function, while the row below it is the location that the code will return to once the current function returns. The call stack also displays interrupt handlers as an entry in the call stack.
Labels: When labels are defined for the PRG ROM offset matching the function’s entry point, that label is shown as the function’s name in the call stack.
To view the code at any location in the call stack, double-click on the row.
Labels
 Label List
Labels can be used to simplify debugging. They allow you to give names to variables and functions which will be used instead of numeric addresses when viewing the code in the debugger. Labels can also be used to display single and multi-line comments to the code.
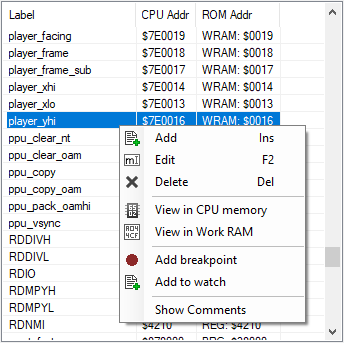
The label list displays every label defined in alphabetical order.
To add a label, right-click in the label list and select Add.
To edit a label, right-click in the label list and select Edit.
To delete a label, right-click in the label list and select Delete.
To add a breakpoint to a label, right-click in the label list and select Add breakpoint.
To add the label to the watch, right-click in the label list and select Add to watch.
To view the code at the label’s location, double-click on the label in the list.
To view the label in the hex editor, use any of the View in [...] options shown in the right-click menu.
Show Comments controls wheter or not code comments that are not labelled are shown in the label list.
Note: Labels shown in gray color and italic font are currently not mapped in CPU memory.
Editing Labels
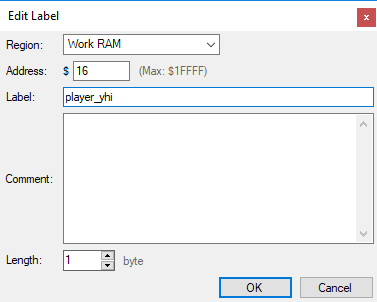 Edit Label Window
Labels can be defined on different types of memory, depending on the CPU.
There are some restrictions on what a label can contain – in general, they must begin with a letter or an underscore and cannot contain spaces or most non-alphanumeric characters. Labels can also contain a comment which is shown in the code window as well as in the tooltips that are displayed when putting your cursor over a label in the code window.
Multi-byte labels can be defined using the Length setting. This can be used to define multi-byte values, arrays or pointers in the code. Multi-byte labels will be shown with a +X offset modifier when referred to in the code window (e.g: MyArrayLabel+2)
CPU Memory Mappings
 CPU Memory Mappings
Note: This is a Game Boy debugger specific feature.
The CPU memory mappings are visual aids that display information about the currently selected PRG/Work RAM/Save RAM banks.
Other Options
Break Options
The Break Options submenu contains a number of options to configure under which conditions the debugger will break (even when no breakpoint is hit).
The available options vary based on the CPU type.
- Break on power/reset: Break the emulation whenever a reset or power cycle occurs.
- Break when debugger is opened: The emulation will break when you first open the debugger.
- Break on BRK: Break the emulation whenever a BRK instruction is about to execute.
- Break on COP: Break the emulation whenever a COP instruction is about to execute.
- Break on STP: Break the emulation whenever a STP instruction is about to execute.
- Break on WDM: Break the emulation whenever a WDM instruction is about to execute.
- Break on uninitialized memory read: Break whenever the code reads from a memory address containing an uninitialized value. Note: This option only works if the debugger has been opened since the last reset or power cycle.
- Bring debugger to front on break: When enabled, the debugger window will get focus whenever a break/pause occurs.
- Break on invalid OAM access (Game Boy only): Break if the CPU attempts to read or write to OAM when it is not allowed to do so.
- Break on invalid VRAM access (Game Boy only): Break if the CPU attempts to read or write to video RAM when it is not allowed to do so.
- Break on LCD disable outside vblank (Game Boy only): Break if the program disables the LCD outside of vertical blank. This may cause damage to the Game Boy’s LCD and should be avoided.
- Break on invalid instructions (Game Boy only): Break if the CPU executes one of the invalid instructions.
- Break on LD B,B (nop) (Game Boy only): Break if the CPU executes the LD B, B ($40) instruction, which is a NOP. This can be used to add software breakpoints by using this instruction in your code.
How To: Edit Code
From the code window, you can select code (via click and drag, or shift+arrow keys) and use the “Edit Selected Code” command to open the Assembler and edit that section of code. The assembler recognizes labels and allows you to define temporary labels as well. If the new code is smaller (in terms of bytes) than the original code, the extra bytes will be replaced by NOPs. If the new code is larger, it will override whatever comes next in the code – a warning will be shown beforehand in this case. When you’re ready to apply your modifications, press the Apply button.
If you want to save your code modifications to a .nes file, or as an IPS patch, you can use the File→Save or File→Save edits as IPS commands.