Performance Profiler
 Performance Profiler
The profiler automatically collects data about all function calls done by the code, as well as the number of clock cycles spent in each respective function. Using the profiler makes it easy to find the bottlenecks in a game’s code, which can help code optimization efforts.
The SNES’ main CPU, the SPC, the SA-1 and the Game Boy CPU are all supported by the profiler. Each will appear in its own tab.
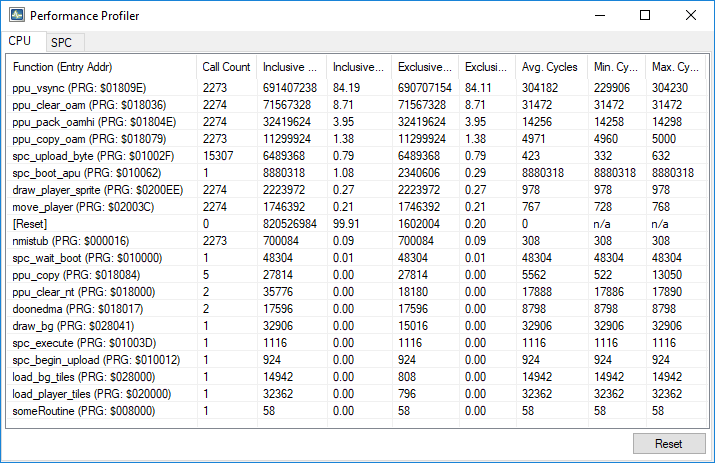
The following columns are shown in the list:
- Call Count: The number of times this function was called during profiling
- Inclusive Time (Cyc): The amount of cycles spent within this function (including the cycles spent by all functions called by this function)
- Inclusive Time (%): The relative portion of CPU time spent within this function (including the time spent by all functions called by this function)
- Exclusive Time (Cyc): The amount of cycles spent within this function (functions called by this function are excluded)
- Exclusive Time (%): The relative portion of CPU time spent within this function (functions called by this function are excluded)
- Avg. Cycles: The average number of cycles taken by this function
- Min. Cycles: The minimum number of cycles taken by this function (e.g the fastest execution time across all of its calls)
- Max. Count: The maximum number of cycles taken by this function (e.g the slowest execution time across all of its calls)
Use the Reset button to reset the profiler’s data – use this when you want to profile a specific portion of the execution.