Debugger
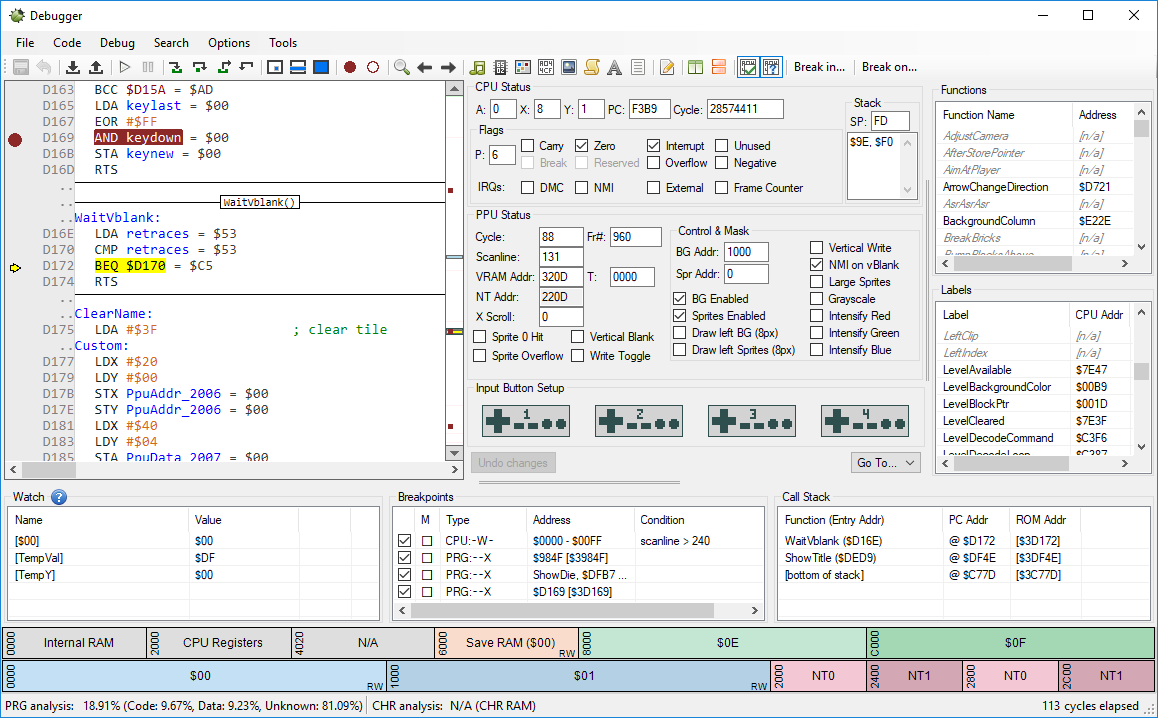 The debugger window
The debugger is the main part of the debugging tools available in Mesen. This window displays the disassembled code, allows you to configure breakpoints, labels and watch values. It also contains a large number of options and smaller features – all of which are described below.
General Usage Tips
Most elements in the debugger’s interface have right-click menu options - make sure you explore the right-click options available in each list and window.
Watch expressions, breakpoints and labels are automatically saved on a per-rom basis in a Workspace.
You can completely reset the workspace for a specific rom by using the File→Workspace→Reset Workspace command.
Search Tools
There are a number of different tools that can be used to search/navigate the code:
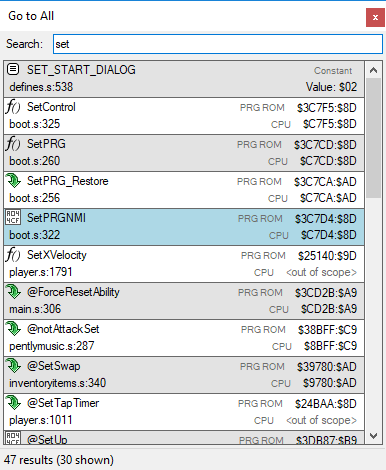 Go To All
- Go To All: The Go To All feature allows you to search for any label by its name and navigate to it. It also works with CA/CC65 and displays the location of the labels in the original source code. (Ctrl+,)
- Find/Find Next/Find Previous: Incremental search that can be used to search through any text shown in the code window (Ctrl+F)
- Find All Occurrences: Search the code for a specific string or label and return all the results in a list. (Ctrl+Shift+F)
- Go To…: These options allow you to quickly reach the NMI, IRQ or Reset handlers or a specific address (Ctrl+G)
Customizing the debugger
All keyboard shortcuts can be customized in Options→Customize Shortcut Keys
The font used in the code window can be customized in Options→Font Options→Select Font
The colors used for syntax highlighting can be changed in Options→Configure Colors
Various portions of the debugger can be hidden/shown via Options→Show
Code Window
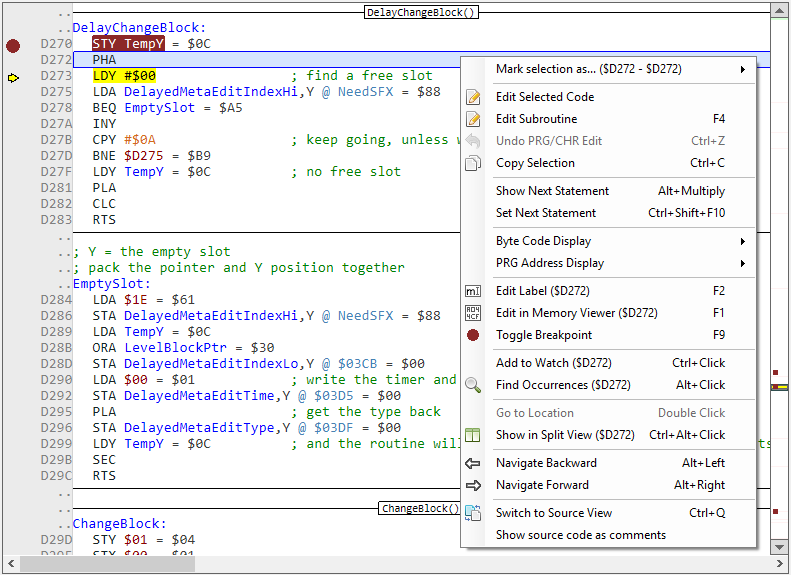 Code Window
The code window displays the disassembled code and contains a number of features and options.
General information
- Several options control what is shown in the code window, and how it is shown - see Display Options below.
- Labels and comments defined in the label list are shown in the code.
- Single-line comments appear on the right, multi-line comments appear on top.
- The instruction that’s currently executing is highlighted in yellow.
- Mouse-hovering any label or address will display a tooltip giving additional information (label, comment, current value in memory, etc.)
- You can alter the flow of execution by using the
Set Next Statementcommand to change the next instruction to be executed.
Disassembly Options
Disassemble…:
- Verified Code: (Always enabled) Bytes that are known by the debugger to be valid code will be disassembled as code.
- Verified Data: Bytes that are known to be data will be disassembled as code (enabling this is not recommended).
- Unidentified Code/Data: Bytes that have not been used yet by the CPU will be disassembled as code.
Show…:
- Verified Code: (Always enabled) All verified code will be disassembled and shown in the code window.
- Verified Data: Verified data blocks will be shown. If the option to disassemble verified data is enabled, a disassembly of the data will be shown.
- Unidentified Code/Data: Blocks that are not marked as data nor code will be shown. If the option to disassemble unidentified data/code is enabled, a disassembly of the bytes will be shown.
Display OP codes in lower case: When enabled, OP codes are displayed in lowercase letters
Show Effective Addresses: When enabled, the resulting address of indirect addressing modes (e.g LDA $3321, Y) will be displayed next to the instruction in blue. e.g: @ $3323
Show Memory Values: When enabled, every line of code that refers to a specific address in memory will display that address’ current value on the right.
Byte Code Display: When enabled, the byte code matching the instructions will be displayed next to them (either on the left, or on the line below based on your selection)
PRG Address Display: When enabled, the address matching the actual position of an instructions in PRG ROM will be displayed next to the CPU address (or replace it entirely, based on your selection)
Emulation Status
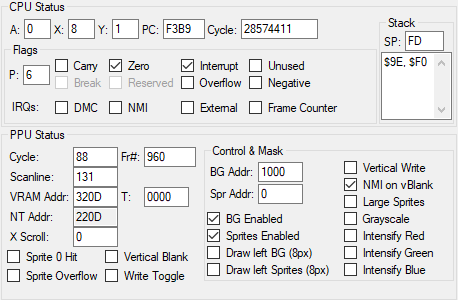 Emulation Status
This section of the debugger window displays the CPU and PPU’s current state.
While execution is paused, most fields are editable. Altering the value of any field will change its corresponding value in the emulation core. To undo any edits you have done by mistake, click the “Undo Changes” button.
Input Button Setup
 Input Button Setup - P1's top and right buttons are pushed
This section lets you force certain buttons to be held down on the NES’ controller. This is often useful when trying to debug input-related code.
Clicking on a button on the mini NES controllers will toggle its state - green buttons are currently being held down.
Watch List/Window
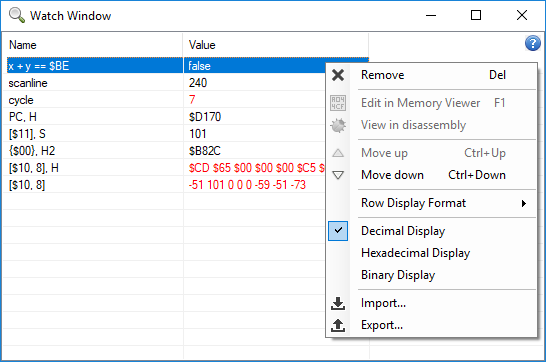 Watch Window
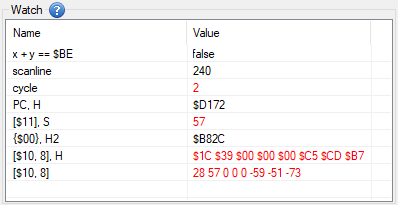 Watch List
The watch window and watch list allow you to evaluate expression and see their value. The Watch Window is a standalone window that can be resized and moved independently from everything else, whereas the Watch List is a part of the main debugger window for quick access to watch expressions.
To add a new watch expression, click on the last empty line in the list to enter edit mode.
To edit a watch expression, double-click on it to enter edit mode.
You can use the right-click context menu to delete or move entries, as well as select formatting options.
An import and export feature is also available to save/load watch expressions from a plain text file.
Syntax
The syntax is identical to C/C++ (e.g && for AND, || for OR) and uses the same operator precedence as well.
Use the $ prefix to denote hexadecimal values (e.g: $FF) or the % prefix for binary values (e.g: %1101)
Operators
The following operators are supported (same usage/precedence as C):
*, /, %, +, -, <<, >>, <, <=, >, >=, ==, !=, &, ^, |, &&, ||, ~, !, (, )
Additionally, the following special operators exist:
- [address/label]: Surrounding a value/expression with brackets will read the corresponding memory address and return its value (1 byte).
- e.g:
[$8000]will read the value at address $8000 and return it.
- e.g:
- {address/label}: Surrounding a value/expression with curly brackets will read the corresponding memory address and return its value (2 byte).
- e.g:
{myLabel}will read 2 bytes of memory at the address represented by themyLabellabel and return its value
- e.g:
- :address/label: Prepending a
:before an address/label will return the offset of the corresponding address within that memory type. If an address is not mapped to any type of memory,-1will be returned.- e.g:
:$8000will return the offset in PRG ROM of the byte currently mapped at the CPU address $8000.
- e.g:
Special values
The following “variables” can be used in both the watch window and contional breakpoints to check the state of specific portions of the emulation core.
Numeric values
- A/X/Y/PS/SP: Value of corresponding registers
- PC: Program Counter
- OpPC: Address of the current instruction’s first byte
- PreviousOpPC: Address of the previous instruction’s first byte
- Cycle/Scanline: Current cycle (0-340)/scanline(-1 to 260) of the PPU
- Frame: PPU frame number (since power on/reset)
- Value: Current value being read/written from/to memory
- Address: Current CPU memory address being read/written
Flags
- Branched: true if the current instruction was reached by a branch/jump instruction
- IsRead: true if the CPU is reading from a memory address
- IsWrite: true if the CPU is writing to a memory address
- IRQ: true if the IRQ flag is set
- NMI: true if the NMI flag is set
- Sprite0Hit: true if the PPU’s “Sprite 0 Hit” flag is set
- SpriteOverflow: true if the PPU’s “Sprite Overflow” flag is set
- VerticalBlank: true if the PPU’s “Vertical Blank” flag is set
Formatting
It is possible to customize the format of each entry by adding a suffix to the expression. Suffixes contain a single letter and are optionally followed by a number indicating the number of bytes expected in the return value (up to 4).
The available suffixes are:
S- Signed decimal valueU- Unsigned decimal valueH- HexadecimalB- Binary
For example, suffixing an expression with:
, H2will display the result as a 2-byte hexadecimal value (e.g:26, H2will display as$001A), Bwill display the result as a binary value (e.g:141,Bwill display as%10001101), S2will display the result as a 16-bit signed decimal value (e.g:$FE4F, S2will display as-433), Uwill display the result as an unsigned decimal value (e.g:180, Uwill display as180)
You can select the default format to use for entries without prefixes by right-clicking and choosing between:
- Decimal Display (equivalent to
S4to all entries - displays the result as 32-bit signed decimal values) - Hexadecimal Display (equivalent to
H1to all entries) - Binary Display (equivalent to
B1to all entries)
Usage Examples
[$10] //Displays the value of memory at address $10 (CPU)
a == 10 || x == $23
scanline == 10 && (cycle >= 55 && cycle <= 100)
x == [$150] || y == [10]
[[$15] + y]   //Reads the value at address $15, adds Y to it and reads the value at the resulting address.
{$FFFA}  //Returns the NMI handler's address.
[$14] | ([$15] << 8), H2  //Display the value of the 2-byte variable stored at $14 in hexadecimal format.
Using labels
Any label defined in the debugger can be used in watch expressions (their value will match the label’s address in CPU memory).
For example, if you have a label called “velocity” that points to 1-byte value at address $30 in the CPU’s memory, you can display its value in the watch using the following syntax: [velocity]
Displaying arrays
The watch window allows you display several consecutive memory values on the same row using a special syntax. e.g:
[$30, 16]      //This will display the values of addresses $30 to $3F
[MyLabel, 10]  //This syntax can also be used with labels
Breakpoints
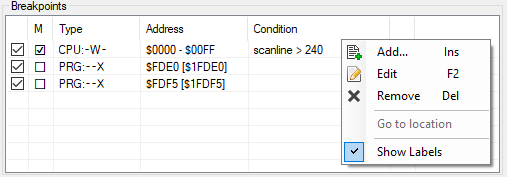 Breakpoint List
Breakpoints define conditions under which the execution of the game’s code will be suspended. Any number of breakpoints can be defined.
You can also make a breakpoint appear as a mark on the Event Viewer by checking the M column.
To add a breakpoint, right-click the breakpoint list and select Add.
To edit a breakpoint, double-click on it in the list.
To disable a breakpoint, uncheck it.
To delete a breakpoint, right-click on it and select Delete
To view the breakpoint in the code, right-click on it and select Go to location
Breakpoint configuration
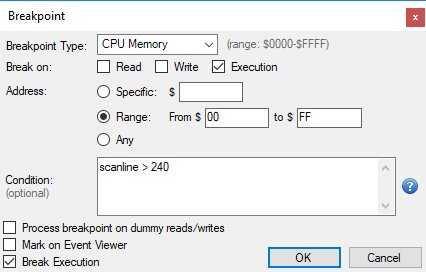 Edit Breakpoint Window
Breakpoints can be set to trigger based on CPU/PPU memory accesses at specific memory addresses.
Breakpoint Type
Select the type of memory for which you want to set a breakpoint. The valid range of addresses for the breakpoint will vary based on the selected memory type.
Break On
Select which types of accesses (read, write or execute) should trigger the breakpoint.
Address
Select which address or address range this breakpoint should apply to.
It is also possible to specify no address at all by selecting Any - in this case, breakpoints will be evaluated on every CPU cycle.
Condition (optional)
Conditions allow you to use the same expression syntax as the one used in the Watch Window to cause a breakpoint to trigger under specific conditions.
Process breakpoint on dummy reads/writes
When enabled, the breakpoint will be processed for dummy reads and writes (only available for read or write breakpoints). When disabled, the debugger will never break on a dummy read or write for this breakpoint.
Mark on Event Viewer
When enabled, a mark will be visible on the Event Viewer whenever this breakpoint’s conditions are met. This can be used to add marks to the event viewer based on a variety of conditions by using conditional breakpoints.
Break Execution
This enables the breakpoint - if this is disabled, the execution will not break when the breakpoint is hit.
Examples
To break when the sum of the X and Y registers is 5:
x + y == 5
To break when the value at memory address $10 is smaller or equal to $40:
[$10] <= $40
To break when the CPU writes the value $60 to any address:
IsWrite && Value == $60
Call Stack
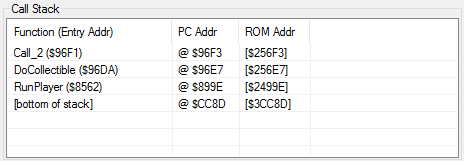 Call Stack example with labels
The call stack displays the currently executing function, and all functions that are below it on the stack. The top of the list is the current function, while the row below it is the location that the code will return to once the current function executes the RTS instruction. The call stack also displays NMI and IRQ routine handlers and processes calls to RTI in the same manner as calls to JSR and RTS.
Note: Rows shown in gray and italic represent portions of the call stack that are currently not inside the CPU’s memory (e.g because the PRG banks were changed since that point in the execution).
Labels: When labels are defined for the PRG ROM offset matching the function’s entry point, that label is shown as the function’s name in the call stack.
To view the code at any location in the call stack, double-click on the row.
Labels
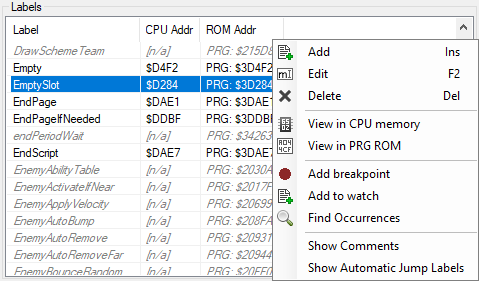 Label List
Labels can be used to simplify debugging. They allow you to give names to variables and functions which will be used instead of numeric addresses when viewing the code in the debugger. Labels can also be used to display single and multi-line comments to the code.
The label list displays every label defined in alphabetical order.
To add a label, right-click in the label list and select Add.
To edit a label, right-click in the label list and select Edit.
To delete a label, right-click in the label list and select Delete.
To add a breakpoint to a label, right-click in the label list and select Add breakpoint.
To add the label to the watch, right-click in the label list and select Add to watch.
To find where a label is used, right-click in the label list and select Find Occurrences.
To view the code at the label’s location, double-click on the label in the list.
To view the label in the hex editor, use any of the View in CPU memory/View in PRG ROM/View in Save RAM/View in Work RAM options.
Show Comments controls wheter or not code comments that are not labelled are shown in the label list.
Show Automatic Jump Labels determines whether or not the labels that are automatically generated by the Auto-create jump labels option are shown in the label list.
Note: Labels shown in gray color and italic font are currently not mapped in CPU memory.
Editing Labels
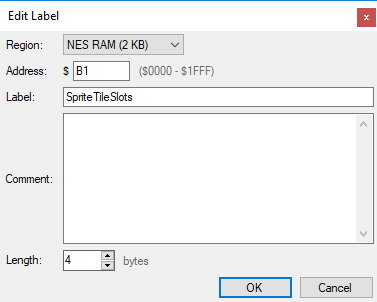 Edit Label Window
Various types of labels can be defined:
- NES RAM (2 KB): Used for labels residing in the $0000-$1FFF memory range (the NES’ built-in RAM)
- PRG ROM: Used for constants, data, code labels and functions in PRG ROM - the address value represents the offset from the start of PRG ROM (which can exceed $FFFF)
- Work RAM: Used for variables in work ram (also called PRG RAM without battery backup) - the address value represents the offset from the start of the ram chip.
- Save RAM: Used for variables in work ram (also called battery-backed PRG RAM) - the address value represents the offset from the start of the ram chip.
- Register: These are used to give name to built-in or mapper-specific registers. For example, the $2000 PPU register could be renamed to “PpuControl”.
There are some restrictions on what a label can contain – in general, they must begin with a letter or an underscore and cannot contain spaces or most non-alphanumeric characters. Labels can also contain a comment which is shown in the code window as well as in the tooltips that are displayed when putting your cursor over a label in the code window.
Multi-byte labels can be defined using the Length setting. This can be used to define multi-byte values, arrays or pointers in the code. Multi-byte labels will be shown with a +X offset modifier when referred to in the code window (e.g: MyArrayLabel+2)
Function List
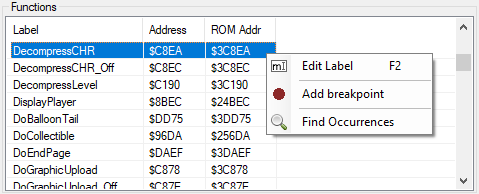 Function List
The function list is similar to the label list and allows you to easily add or edit the name of functions (which are also labels).
Unlike the label list, which only displays labels, the function list displays all known functions, including those with no labels. This is useful to quickly check an unnamed function’s code (by double-clicking on it) and give it a name. This can help when attempting to reverse-engineer code.
CPU/PPU Memory Mappings
 CPU/PPU Memory Mappings
The CPU and PPU memory mappings are visual aids that display information about the currently selected PRG/CHR banks and the nametable configuration.
The banking configuration represents Mesen’s internal representation of the mapper in use, which may not exactly match the mapper’s specs. For example, a mapper with 2x 8 KB + 1x 16 KB PRG banking is emulated as 4x 8 KB internally, so it will appear as four 8 KB banks.
Other Options
Display Options
The Show... submenu contains a number of options to show/hide various elements on the UI.
Specifically, the toolbar, CPU/PPU memory mappings, function/label lists, watch list, breakpoint list and the call stack window.
Tooltip Options
A number of tooltip-related options are available here:
- Show Code Preview in Tooltips: When enabled, label/address tooltips will now show a preview of the code at the target location.
- Show OP Code Info Tooltips: When enabled, putting the mouse over an OP code will display a tooltip containing information about the OP code and which CPU flags are affected by it.
- Only show tooltips when Shift key is pressed: When enabled, no tooltips will be shown unless the shift key is held down.
Break Options
The Break Options submenu contains a number of options to configure under which conditions the debugger will break (even when no breakpoint is hit):
- Break on power/reset: Break the emulation whenever a reset or power cycle occurs.
- Break on unofficial opcodes: Break the emulation whenever an unofficial opcode is about to execute.
- Break on BRK: Break the emulation whenever a BRK instruction is about to execute.
- Break on CPU crash: Break the emulation whenever an instruction that will cause the CPU to freeze is about to execute.
- Break on bus conflict: Break whenever a bus conflict is detected. This option only causes a break when using mappers that have bus conflicts enabled.
- Break on decayed OAM read: Break whenever the code a read is performed on decayed OAM memory. Note: This option is only available when the
Enable OAM RAM decayoption is enabled in theEmulation Settings. - Break on $2006 scroll glitch: Break whenever the $2006 scroll glitch is triggered by a write to $2006. Note: This option will only trigger a breakpoint if the option to emulate the glitch is turned on
- Break on uninitialized memory read: Break whenever the code reads from a memory address containing an uninitialized value. Note: This option only works if the debugger has been opened since the last reset or power cycle.
- Break when debugger is opened: The emulation will break when you first open the debugger.
- Break on debugger focus: Whenever the debugger’s window gains focus (e.g by clicking on it), the emulation will break.
- Break on Init (NSF): Break when the NSF’s Init routine is called.
- Break on Play (NSF): Break when the NSF’s Play routine is called.
Enable sub-instruction breakpoints: This option allows Mesen to process breakpoints in the middle of CPU instructions. This was the default up to version 0.9.7. When this option is disabled, the debugger will break at the beginning of CPU instructions only (and will only break once per instruction). This option is disabled by default as of 0.9.8.
Additionally, you can configure whether or not the debugger window gets focused when a break or pause occurs.
Copy Options
These options configure which portions of the code is copied into the clipboard when copying code from the code window.
Layout Options
- Split View: Displays 2 separate code windows side-by-side.
- Vertical Layout: Moves the location of the label and function lists to improve space utilization on larger screens.
Misc. Options
- Auto-create jump labels: When enabled, the debugger will automatically generate labels for all jumps/branches in PRG ROM (when it executes the branch instruction). These are labelled
L#####, where#####is the label’s location in PRG ROM.
- Hide Pause Icon: When enabled, the pause icon that is normally shown whenever execution is paused will be hidden.
- Draw Partial Frame: When enabled, the emulator’s main window will display the current partially-drawn frame instead of the last complete frame.
- Show previous frame behind current: When enabled along with
Draw Partial Frame, the previous frame’s data will be shown behind the current frame.
- Show break notifications: When enabled, a “notification” will be shown over the disassembly window indicating what caused the debugger to break the execution (e.g: a CPU/PPU read/write, a decayed OAM read, etc.)
- Show instruction progression: When enabled, the code window will display an indicator showing how far along into the current instruction the execution is. This also shows an estimate of how many cycles the instruction will take to complete (this estimate may increase for various reasons such as a page being crossed, etc.).
Ris read,Wis write,Xis execution,DRis a dummy read, andDMCis an APU DMC read - Show selection length: When enabled, the code window will display the current selection’s length in bytes (when more than 1 line is selected)
- Keep active statement in the center: When enabled, the code window will always put the current statement in the center whenever it updates (causing it to scroll on every step). When disabled, the code window will only scroll the code when necessary.
- Refresh UI while running: When enabled, the watch window and the CPU/PPU status will be updated continuously while the emulation is running (instead of only updating when the execution breaks)
Workspaces
Debugger “workspaces” are used to store information specific to each ROM you debug. This includes watch expressions, breakpoints and labels.
Default Workspace Labels
By default, Mesen setups labels for the NES’ PPU and APU registers. These can be disabled using the Disable default labels option.
Additionally, it’s possible to setup your own set of default labels by creating a file called DefaultLabels.Global.mlb in the Debugger folder (where the workspace and CDL files are stored). When Mesen finds this file, it will ignore the its own default labels and use the ones contained in that file instead, for all ROMs.
You can also setup default labels for specific mappers by creating a file called DefaultLabels.[mapper number].mlb (e.g, for MMC3 games: DefaultLabels.4.mlb).
For FDS and NSF ROMs, DefaultLabels.FDS.mlb and DefaultLabels.NSF.mlb can be used, respectively.
If both a global and mapper-specific mlb is found, both of them will be used (with the mapper-specific file having priority in case of conflicting labels).
.mlb files are a Mesen-specific file format to define labels/comments in the code. They are written in a simple text format and can also be created by using the debugger’s Export Labels feature.
Performance Tracker
From the code window, you can right-click on an address and activate the “performance tracker”. This feature will track when the selected address is executed by the CPU on each frame, and display a CPU/FPS chart overlay based on those statistics.
By setting the performance tracker to the part of the code that most games use to wait for vertical blank after the next frame’s logic is done processing, you can get an estimate of how much extra CPU time remains on each frame.
How To: Edit Code
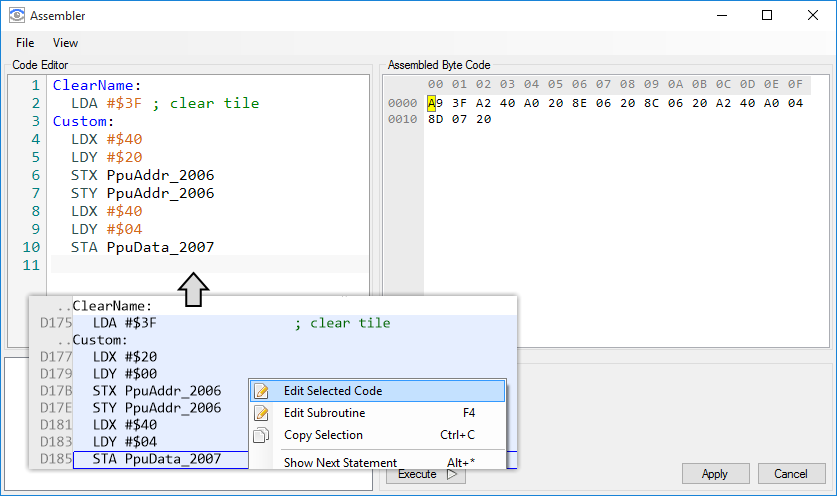 Using "Edit Selected Code" from the code window allows you to edit the code in the assembler
From the code window, you can select code (via click and drag, or shift+arrow keys) and use the “Edit Selected Code” command to open the Assembler and edit that section of code. The assembler recognizes labels and allows you to define temporary labels as well. If the new code is smaller (in terms of bytes) than the original code, the extra bytes will be replaced by NOPs. If the new code is larger, it will override whatever comes next in the code – a warning will be shown beforehand in this case. When you’re ready to apply your modifications, press the Apply button.
If you want to save your code modifications to a .nes file, or as an IPS patch, you can use the File→Save or File→Save edits as IPS commands.